
Nitesh Kumar Sardana, Robert Bosch Engineering and Business Solution Pvt. Ltd.
Electronic products operate in varied thermal environments. Their operation is challenged when the size of the housing is reduced and when the product is mounted in an open environment exposed to climatic conditions. Solar radiation increases the temperature difference of the product’s internal air from the ambient by 150 percent to 300 percent.
The thermal challenges are amplified if the internal heat generation is relatively high and it is compounded by aggressive external conditions. Throughout the lifetime of the product, heat generation inside the product and the external ambient varies. At Bosch, we performed thermal simulations with computational fluid dynamics (CFD) for various designs to help define the upper limit of the temperature for this type of product’s battery.
The Product Under Test
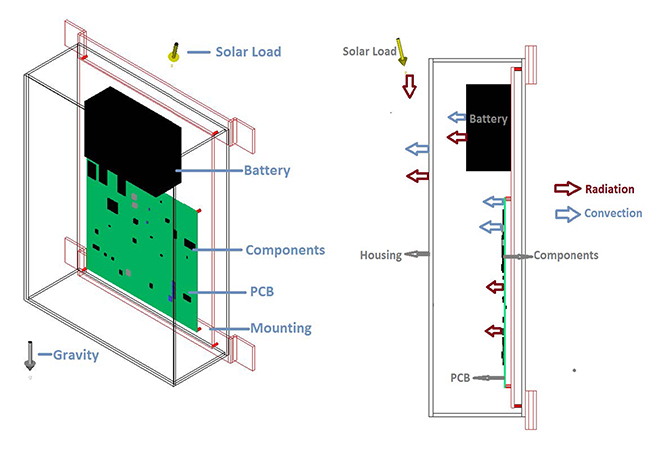
We conducted our simulations and analyses based on the scenario that the product would be mounted vertically on an outdoor pole in Brazil. The device’s plastic housing encloses the battery and PCB with active and passive components. The housing has a gasket to prevent air leakage and to provide IP65 compliance. The enclosure is dust and watertight, keeping out water projected in jets from any direction. This constraint means that air is not exchanged between the internal and external environment, which creates a 25 percent higher temperature (for this product) inside the housing compared to non-IP65–protected housing at nominal wind speed.
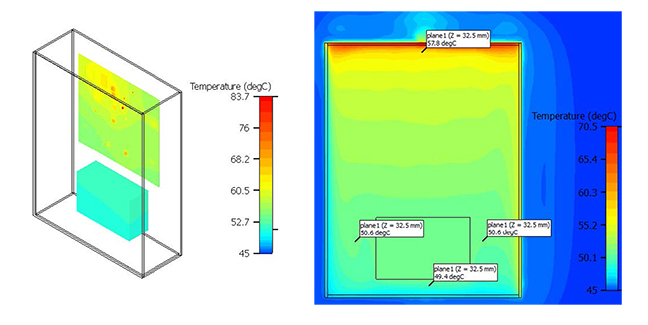
Inside the housing, the battery is mounted on a metallic plate and the PCB is mounted on screws, both avoiding direct contact with the plastic housing (Figure 1). We ignored the internal heat dissipation of the battery because the current withdrawn by the battery is below the critical current value.
The Simulation Model
We conducted steady-state thermal simulation using the CFD software, FloTHERM, simulating all three modes of heat transfer: conduction, convection, and radiation. The simulation model consisted of the device as well as the ambient air surrounding it. We modeled the PCB as “lumped†with orthotropic thermal conductivity. Active components (such as semiconductor packages) were modeled explicitly, whereas passive components (such as capacitors and resistors) were modeled as lumped.
The highest temperature officially registered in Brazil was 44.7˚C in Bom Jesus, Piauà state on November 21, 2005. For the worst-case condition in simulation, we used the ambient temperature of 45˚C. Previous simulations proved that the wind impinging on the front of the housing and sun exposure on the top of the housing would lead to maximum temperature for the components.
During the steady state, the heat would be balanced between internal heat generation, heat transfer caused by solar flux, and heat transfer from the housing to ambient. Conduction would occur between bodies that are in direct contact, and this is not shown in the heat transfer path (Figure 1). The battery does not dissipate power, and it is heated up by conduction through the surface area in contact with the mounting plate, through convection from the internal air, and through radiation from the adjacent surfaces.
The Tests and Analysis Results
For analyzing the critical state of the product, the temperature of individual components was compared with its temperature limit. Because the battery contains chemicals, its ambient air temperature must be below a specified temperature limit. The temperature in and around battery will vary throughout its lifetime. We performed simulation for various wind speeds and designs with constant internal heat generation and solar flux.
The base measurement with which to compare our simulations were done in a lab for no solar load and 2 m/s air flow around the product. Measured temperature of the components on the PCB were in the range of ± 5 percent as predicted from our simulation for the similar conditions.
Our first simulation was for no solar load, which would occur at night. Figure 2 shows the trajectory of the particles around the battery, which rise because of natural convection inside the product and rebound. This flow leads to hot air accumulating around the battery.
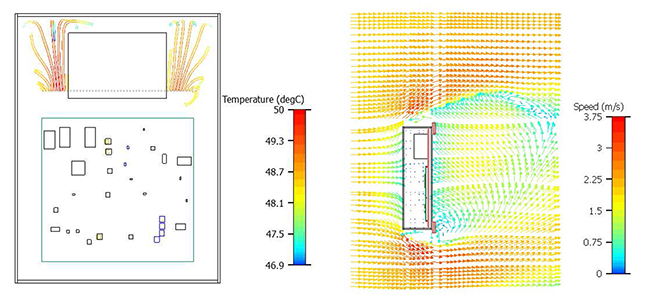
With the baseline design, we simulated for worst-case conditions in the field. During its lifetime, the minimal wind speed that the product would experience in Brazil is 2 m/s. The solar load from the top combined with wind impinging on the front would lead to maximum internal air temperature. The direction of wind impingement and the wind flow after hitting the housing is also shown in Figure 2.
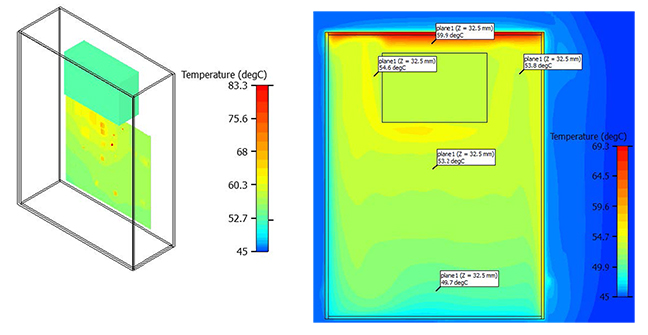
Temperature around the battery is in the range of 53ËšC to 60ËšC (Figure 3). However, the temperature at the bottom of the housing is around 50ËšC, which is 5ËšC less, on average, than the temperature at the top. We concluded that changing the product design by shifting the battery from top to bottom can reduce the temperature around the battery from 55ËšC to 50ËšC.
During its lifetime, the product would experience different wind speeds. So we conducted simulations for various values of wind speed (Table 1). No wind speed condition is a hypothetical situation for the product; however, we wanted to obtain a better understanding of the temperature around the battery and we needed this information for comparison. No wind could be possible for a small duration, if the wind around the product was blocked by some obstacle.
Table 1. Simulation results for different wind speeds.
|
Case |
Ambient (C) | Air flow(m/s) | Battery location |
Maximum surface temperature of battery (C) |
Air around battery (C) |
|
1 |
45 |
0 |
Top |
61.6 |
63 |
|
2 |
45 |
1 |
Top |
54 |
55 |
|
3 |
45 |
2 |
Top |
53.2 |
54 |
|
4 |
45 |
4 |
Top |
51.4 |
52 |
|
5 |
45 |
6 |
Top |
50.8 |
51 |
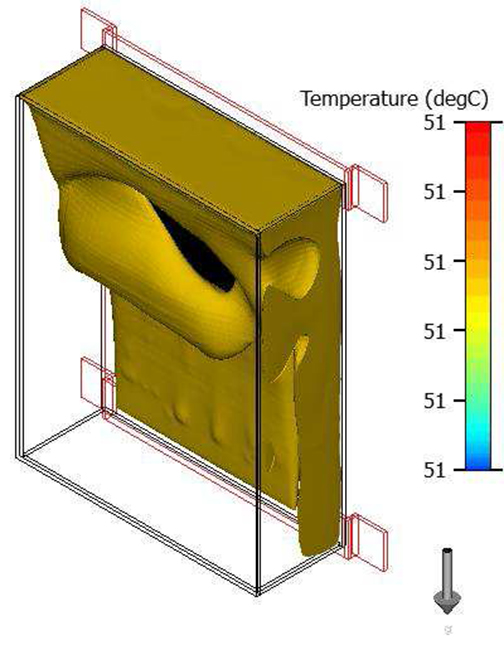
We then conducted simulation for the maximum wind speed of 6 m/s, considering turbulence in the environment. Figure 4 shows the iso-surface for the temperature of the air around the battery. Iso-surface is the locus of all the points having constant temperature of value shown in the temperature scale.
Next, we performed simulations in which the battery is placed at the bottom, at a wind speed of 2 m/s (Figure 5). The maximum temperature of the component was 83.7ËšC and of the battery was 51ËšC. We then conducted simulations for the new design at a wind speed of 6 m/s.
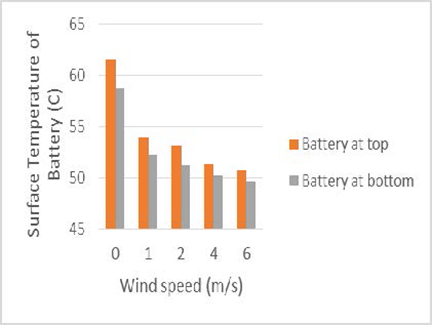
The results for all the simulations conducted at different values of wind conditions with battery at the top and battery at the bottom are shown in Figure 6. The graph shows an exponential decrease in temperature of the battery with increase in wind speed.
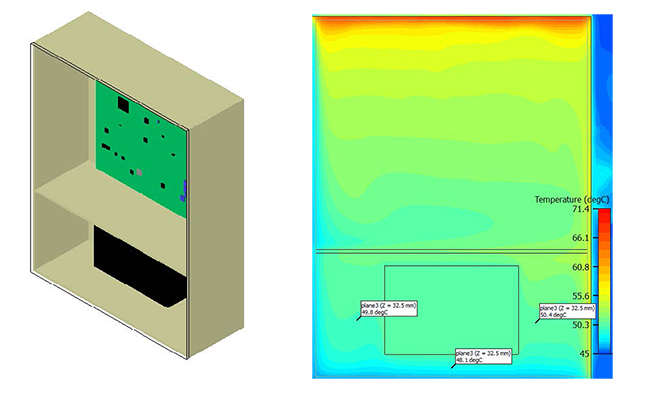
To further reduce the temperature of the battery, we added a partition inside the housing to separate the battery from the PCB and components. The temperature field at midsection of the battery in Figure 7 shows that the temperature was reduced around the battery. This reduction in temperature can be attributed to less radiation and convection heat transfer to the battery from the top surface of the housing, PCB, and components.
Optimizing the Design and Recommended Use
The temperature around the battery is a critical parameter while designing such a product. Minor changes in design can significantly reduce battery temperature. For the baseline model (the original design with solar load and 2 m/s wind speed), the temperature around the battery was 54ËšC. Changing the orientation and modifying the housing to separate the battery would reduce the effect of hot air inside the product to the battery. This simple design change reduces the temperature difference between the battery and the ambient by 5 percent.
Other design changes could be made to allow air flow inside the housing. Such a design modification would reduce the temperature difference between the battery and ambient by 25 percent for wind speed of 2 m/s. However, this modification would involve changing the IP65 specification of the product and increases the manufacturing cost.
The temperature difference between the battery and outside air would have been 200 percent less if the product was not exposed to the sun. Changing how the product is oriented would also reduce the temperature difference between the battery and ambient by 15 to 25 percent for various wind speeds. Changing how the product could be mounted on the pole would require only few design modifications and negligibly affect the product’s cost.
Using thermal simulations, with its fidelity proven by measurements, to test and analyze various designs helped us to define the upper limit of the temperature of the battery. Based on the conditions of varied ambient temperature, wind speed, and solar flux, we can determine the temperature in and around battery. This calculation allowed us to define the necessary time to replace the battery, which also helps to determine the maintenance cost of the product. For any product, the maintenance cost plays an important role while choosing from ocean of choices. And, as Bosch is a market leader in electronics, we emphasize every aspect of cost.
Acknowledgments
Contributing authors include Nitesh Kumar Sardana, Ritwik Alok Pattnayak, Susyamala Pavan, Kumar Busam, Chandan Kumar Ghosh, and Laxmidhar Biswal.
This study was first published at the IEEE 2016 International Conference on Electronics Packaging (ICEP).
Nitesh Kumar Sardana has a Masters degree in Thermal Science and Bachelors degree in Mechanical Engineering from the Indian Institute of Technology in Kharagpur. He works on thermal management of electronics at Robert Bosch Engineering & Business Solution (RBEI), Bangalore, India.