
Dr. John Parry, Mentor Graphics Corp.
The particular power cycling strategy you choose for high-power semiconductor devices, such as power transistors, diodes, MOSFETs, and IGBTs, during reliability tests can have a significant effect on predicted lifetime results even if the tests have similar initial parameters. Also, how you set up the measurements can affect the results of the power cycling tests.In real application conditions, power electronics modules are exposed to both long- and short-load cycles, so for proper lifetime prediction, the duration of heating should be taken in account as well as junction temperature change. This article describes how a new method that combines thermal resistance measurements with structural testing can provide more accurate results in less time for predicted lifetime operation than commonly used methods.
The Challenge of Accurately Predicting Lifetime Reliability
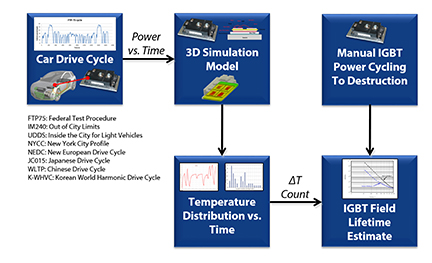
The definition of field lifetime depends on how the product is used. In the case of a car, reliability is normally assessed against a standardized drive cycle, which is translated into a power versus time profile for the electric powertrain and is also used to create a profile for individual components such as IGBTs (Figure 1). Then, a junction temperature profile versus time is created with a simulation model that uses the power versus time profile. The magnitude and number of the temperature swings this changing power profile produces are then counted. The greater the magnitude of the temperature swing, the greater the effect on lifetime. The magnitude of the predicted temperature change also can be used to define the target temperature changes for active power cycling experiments that are used to measure failure rates in the lab.
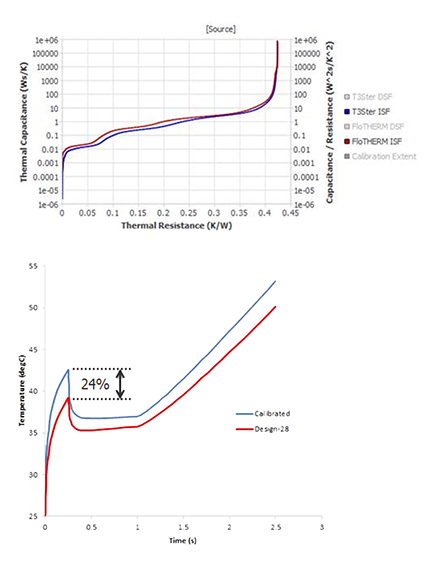
The accuracy of a simulation model depends on the geometric data and the predicted material properties. Normally, the geometry is well-known; however, the material properties are not known precisely, or perhaps only their expected range is known but not the accurate number. If the accuracy of the model is only checked against a steady-state temperature value, the dynamic behavior required for the lifetime estimation may be wrong; in fact, the model may produce a temperature rise that is wrong by more than 20 percent or more when subjected to a short power pulse (Figure 2). Predicting the wrong temperature rise in the application can have a big effect on the predicted reliability. With the trend toward higher operating temperatures supported by silicon carbide devices, where the temperature can change by as much as 140°C, under-predicting the temperature rise by 20 percent or more will result in an over-estimation of lifetime by more than 60 percent.
The only way to verify the dynamic behavior precisely is to check the unit step response of the simulated system and then compare it to a measured Zth curve or structure function.
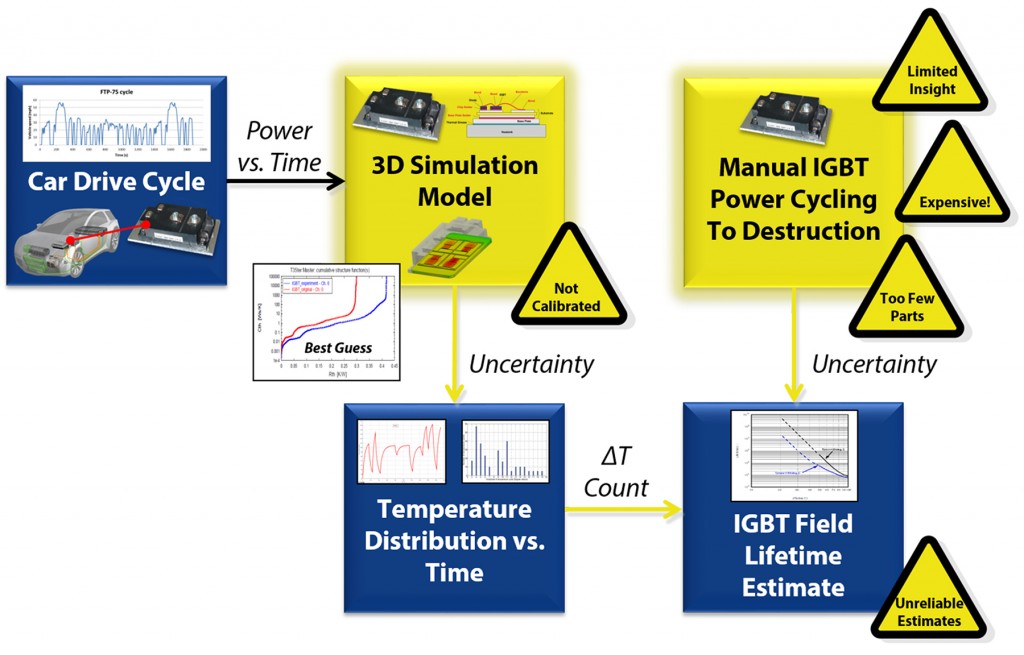
Also, the predicted junction temperature swings in the application are often used to plan lifetime tests, and inaccurate simulation can result in a poor choice of test conditions. The lifetime tests are lengthy; they involve a lot of manual effort, which means they are costly. For these reasons, plus the limited availability of testing facilities, too often, too few parts are tested to obtain a statistically reliable set of lifetime data from the tests. Dependable field lifetime estimates are hampered by the fidelity of the simulation models used, as well as the quantity and quality of test data (Figure 3).
How to Get More Accurate Results
The field lifetime of power modules can be accurately estimated using a method that combines thermal simulation software, such as FloTHERM, and the new Power Tester 600A [1] to ensure that the simulation model is as accurate as possible. The first step in this method is to test the CAD model of the as-designed product in the simulation software to confirm its performance: electrically, thermally, mechanically, etc. Once the design is close to finished, create samples in a pre-production pilot run to check issues before bringing the part into full production, including checking the processing of materials, design for manufacturability, and optimizing process window settings such as cure times and temperatures.
At this stage, you can check the thermal performance of the actual parts against the expected performance. Various things can cause the performance to be different from the expected performance, such as material properties, thicknesses of glue and solder layers, and contact resistances between materials.
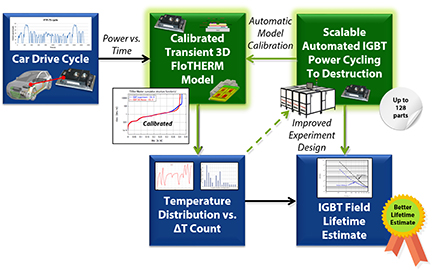
The Power Tester can then be used to run the power module through power-cycling tests and to automatically generate a structure function that illustrates its characterization. It’s best to test several parts to check for variability before ramping up to full production. Differences in behavior during the power-cycling tests can be detected by comparing the structure function for the actual part against that for the simulation model, which may lead to changes to the pilot manufacturing process and/or changes to the thermal model. The thermal model is changed to match the physical results by automated model calibration in the simulation software, varying those parameters known to have uncertainty associated with them, to get a model that matches reality to within ~99.5 percent accuracy.
A model that matches physical reality can be used to predict the temperature rise vs. time across a drive cycle from the many power on/power off events that the power modules experience as part of the electric drive-train. The model provides a series of swings in temperature (ΔT) that can be put through a counting algorithm to identify the ΔT distribution (magnitude and count), which is characteristic to the given driving cycle. These numbers, obtained using the calibrated model of the part, define a range of temperature swings used in active power-cycling experiments that are relevant to the application.
Using the calibrated thermal model, you can choose the power level, as well as power-on and power-off periods, for active power-cycling measurements with confidence. The active power-cycling experiments can be run for the ΔTs of interest to obtain failure rate data (average cycle number to failure at selected ΔT/s lifetime curve) for as many as 128 components per centrally controlled experiment, by chaining eight Power Testers. In this way, field lifetime for the power modules can be predicted more accurately by combining the failure-rate data from the active power-cycling experiments with temperature-swing information obtained by simulation across the drive cycle and failure models that cover the active failure mechanisms.
Conclusion
When estimating the lifetime reliability of power modules in the field, using thermal simulation software with automated, high-volume, active power-cycling drastically reduces the testing time and cost per part, making it possible to test a higher number of parts cost-effectively, which increases the statistical validity of the lifetime curves and further improves field reliability estimates.
References
1. MicReD, a division of Mentor Graphics, Budapest, Hungary.